Smart Special-Shaped Glass Fiber Cross-Section Analyser
Suitable for scanning and capturing glass fiber bundle cross-sections, automatically calculating fiber cross-sectional area, perimeter, aspect ratio, and enabling automated detection of fiber profile variations.
- After sample preparation, loading, and initiation: automatic scanning, focusing, and measurement
- AI deep learning recognition with image and measurement review for each identified fiber
- One-click report generation; standard applicability depends on the material, method, and validation conditions
- Data can be exported to Excel/PDF, with support for cloud data management
- Simple operation; ordinary workers can take up the post after brief training
Core Features
High-Definition Scanning Results
Utilizing intelligent microrobots and customized cross-section focusing algorithms, combined with proprietary sample preparation technology, to achieve clear visualization of glass fiber cross-sections.
Comprehensive Report
Automatically scans, analyzes, and generates data including cross-sectional area, perimeter, and aspect ratio, while producing automated reports with distributions and histograms.
Visualization and Traceability
Scans entire fiber bundles with multi-layer analysis; algorithms automatically detect complete and incomplete fiber cross-sections, allowing detailed inspection of each fiber's measurement results.
Applications
Precisely analyzes reinforcement material fibers including: glass fibers, carbon fibers, basalt fibers, and other fiber cross-sectional characteristics.
Automatic and Fast
Typical desktop-model test time is approximately 5 minutes; actual timing depends on scan settings and sample conditions.
Technical Parameters
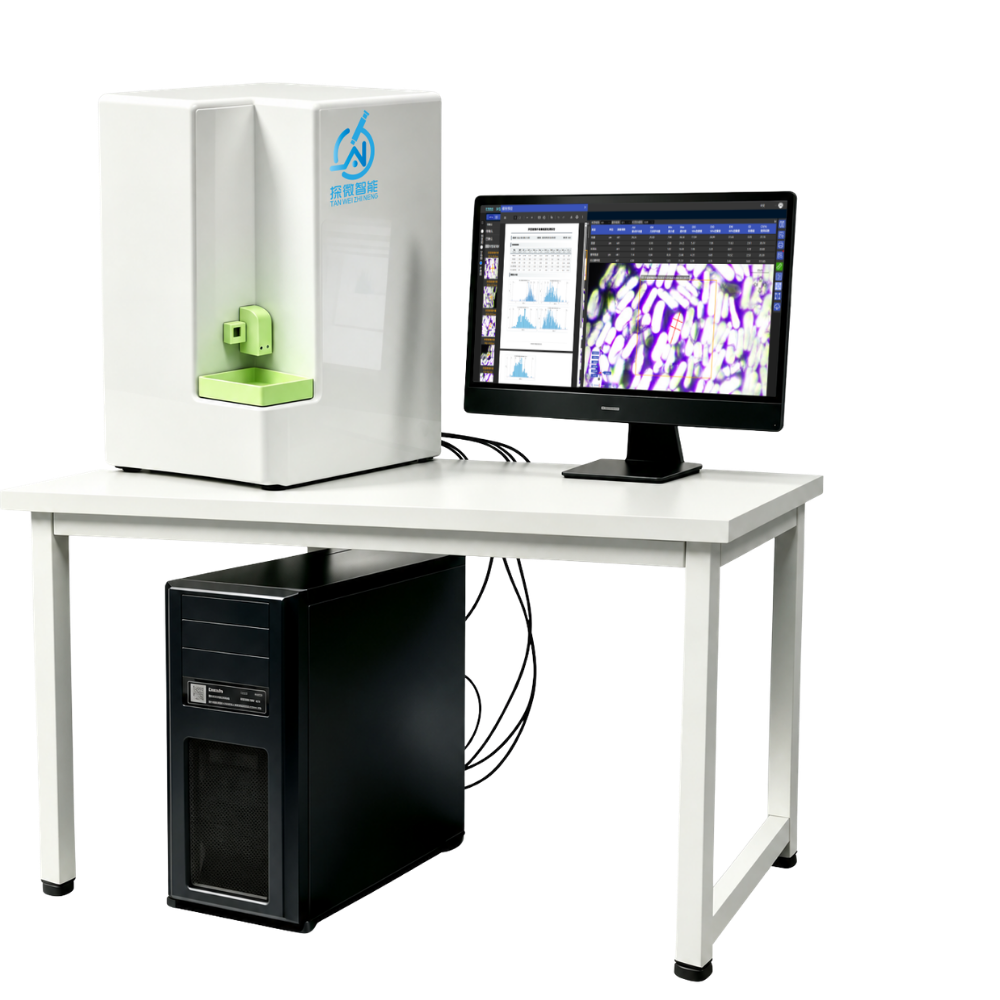
| Product Model | TW-D-10X-N-PGF-A-01 |
|---|---|
| Number of Fibers per Single Measurement | Less than 200 fibers |
| Aspect Ratio Measurement Error and Display Precision | Error ≤0.1; results displayed to 1 decimal place |
| Physical Magnification of Captured Images | 100x |
| Digital Magnification of Captured Images | 1000x |
| Historical Report Storage Capacity | 5,000 reports |
| Digital Slide Storage Capacity | 1,000 slides |
| Power Supply Range | AC220V ±15%, Frequency: 50/60Hz |
| Power Consumption | ≤200VA |
| Operating Temperature | 5℃ ~ 40℃ |
| Humidity Range | ≤80% |
| Sample Loading Capacity | Single slide |
| Scanning Resolution | 0.18±0.05μm/pixel |
| Detection Time | 5min |
| Operating Software | Windows |
Cross-Section Statistics and Image Review Report
This report presents cross-sectional geometry statistics and individual-fiber images for special-shaped glass fibers. The system automatically identifies the cross-sectional contour of each fiber, measures width, minimum width, and length-to-width ratio fiber by fiber, and focuses on cross-sectional dimensions and their distribution patterns, supporting quality analysis, material selection, and result review. Acceptance against a specific standard requires confirmation of its identifier, scope, and test conditions.
- Basic Statistics:Arithmetic mean (AM), geometric mean (GM), standard deviation (SD), coefficient of variation (CV), and maximum/minimum values of width/minimum width, intuitively reflecting batch consistency;
- Characteristic Parameters:D10/D50/D90 are the size values (μm) at the 10th, 50th and 90th percentiles of the corresponding size distribution; the length-to-width ratio is the longest cross-sectional diameter divided by the width;
- Visualization:Histograms of the longest cross-sectional diameter, width, and length-to-width ratio cross-sectional distributions, allowing distribution patterns to be seen at a glance and quickly determining whether they meet the established process requirements.
Easy Access, Efficient Verification
The report supports online viewing. The full content can be accessed directly on the corresponding product page on the official website — no download required, allowing quality verification anytime, anywhere, and improving decision-making efficiency.

Online Trial
Explore glass fiber bundle cross-section scanning, individual fiber profile variations, and comprehensive report results for an authentic testing scenario experience.
* The trial version is similar to the actual product UI, with partial functions available.
Application Scenarios
Widely used in quality inspection for reinforcing fiber manufacturers such as glass fiber, carbon fiber, basalt fiber, and quartz fiber, as well as in materials science research at universities and research institutes.
FAQ
Why should cross-section completeness be checked first?
Video 44 shows dark, blurred, debris-like and incomplete targets. Inspect contours and counting rules before interpreting dimensions, ratios and distributions. A few filtering examples do not establish a filtering accuracy rate.
How can cross-section measurements be reviewed?
Enlarge individual contours and measurement marks, then check the length, width, minimum width, ratios and distribution fields available in the current configuration. Keep historical area and perimeter outputs separate from current-version fields.
Interested in this product?
Feel free to contact us by email or phone, and we will immediately arrange one-on-one support from an engineer.
Contact Us