Smart Alumina Fiber Diameter Analyser
Alumina fiber diameter analysis with image review and automated reports. Supports 10,000 or more fibers under suitable preparation and scan settings. Request sample evaluation.
- After sample preparation, loading, and initiation: automatic scanning, focusing, and measurement
- AI deep learning recognition with image and measurement review for each identified fiber
- Automated reporting; agree on applicable methods and acceptance criteria for your samples.
- Data can be exported to Excel/PDF, with support for cloud data management
- Simple operation; ordinary workers can take up the post after brief training
Core Features
High Precision Diameter Analysis
Review image-linked measurements. Evaluate measurement error using calibration and reference tests.
Comprehensive Report
Automatically scan, analyze, and generate analysis reports, providing average, SD, CV, distribution histogram of diameter and more.
Visualization and Traceability
Supports statistics for 10,000 or more fibers with image-linked diameter markings. Actual counts depend on scan area and sample preparation.
Automatic and Fast
High-throughput scan start to report: approximately 3 minutes, excluding preparation and slide handling. Scan settings affect timing.
Technical Parameters
Prepare separated, non-overlapping fibers of suitable length. Fast mode reduces capture area, count and time. Check actual report counts; large-count capability does not imply a fixed count within the stated time. Software calculation precision is not total measurement error.
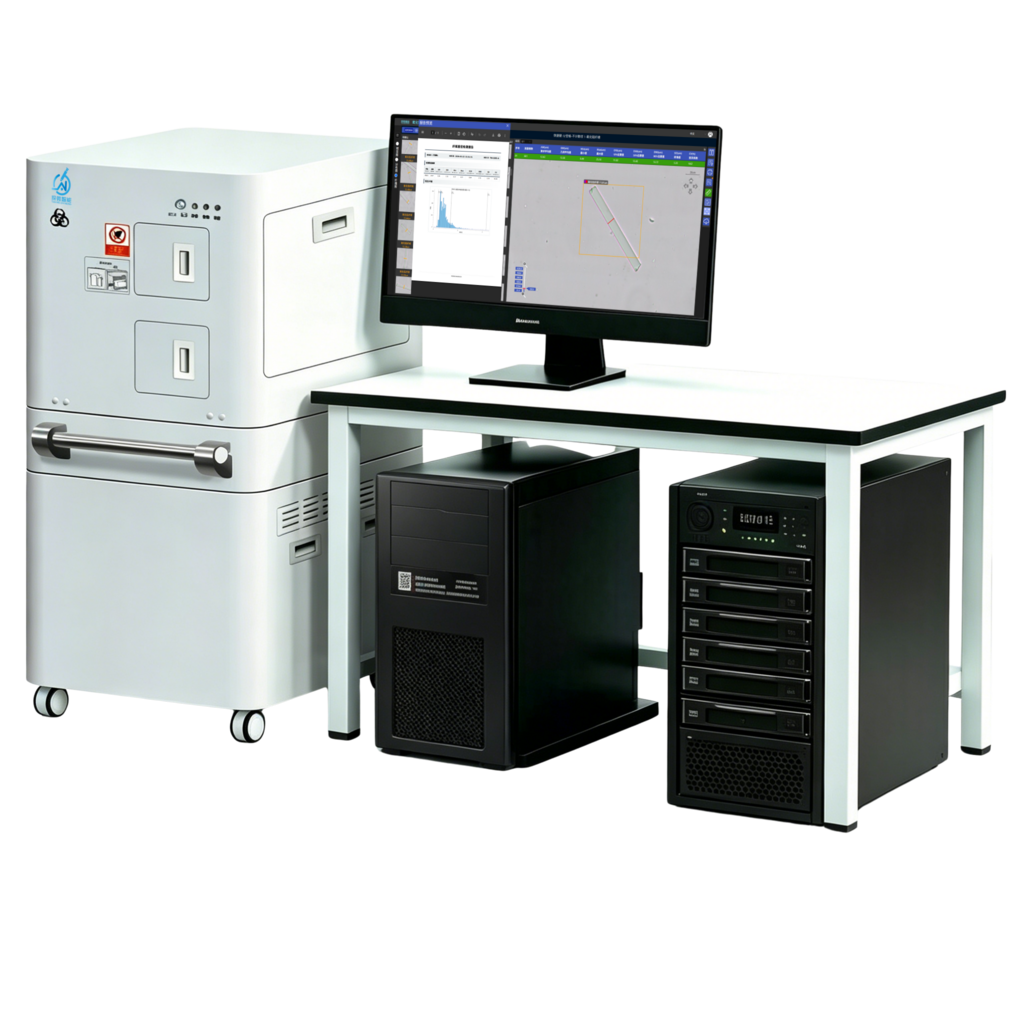
| Product Model | TW-H-20X-N-AOF-D-01 |
|---|---|
| Diameter Range | 4-25 μm |
| Number of Fibers per Single Measurement | Supports ≥10,000 fibers; count depends on scan area and preparation |
| Software calculation precision (not instrument error) | 0.01 μm |
| Physical Magnification of Captured Images | 200x |
| Digital Magnification of Captured Images | 1000x |
| Historical Report Storage Capacity | 100,000 reports |
| Digital Slide Storage Capacity | 20,000 slides |
| Power Supply Range | AC220V ±15%, Frequency: 50/60Hz |
| Power Consumption | ≤300VA |
| Operating Temperature | 5℃ ~ 40℃ |
| Humidity Range | ≤80% |
| Sample Loading Capacity | 30 slides per box, up to 8 slide boxes; supports continuous loading and unloading with replenishment of slide boxes. |
| Scanning Speed | ≤10.6cm²/min |
| Scanning Resolution | ≤0.35 μm/pixel |
| Detection Time | 3 min: scan start to report; excludes preparation and loading/unloading |
| Equipment Operation Stability | 7*24 hours unattended operation |
| Operating Software | Linux, Windows |
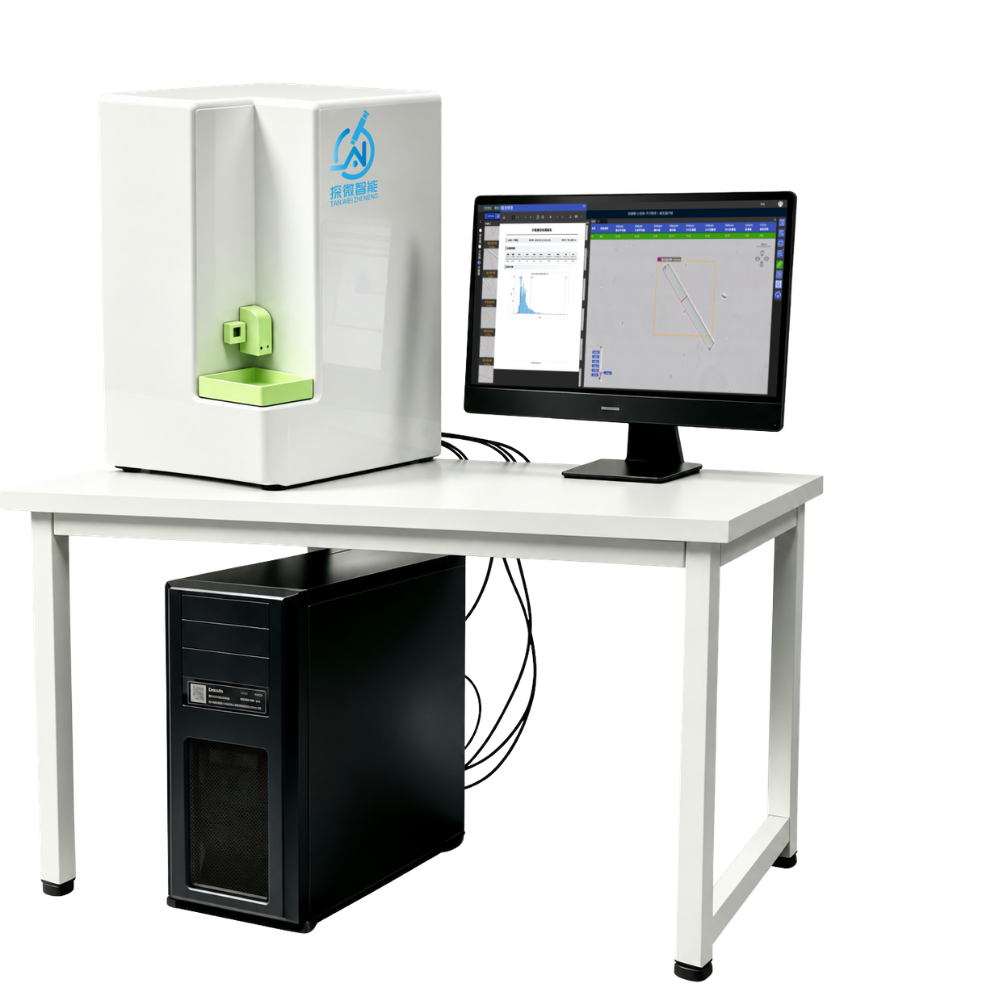
| Product Model | TW-D-20X-N-AOF-D-01 |
|---|---|
| Diameter Range | 4-25 μm |
| Number of Fibers per Single Measurement | Supports ≥10,000 fibers; count depends on scan area and preparation |
| Software calculation precision (not instrument error) | 0.01 μm |
| Physical Magnification of Captured Images | 200x |
| Digital Magnification of Captured Images | 1000x |
| Historical Report Storage Capacity | 2,000 reports |
| Digital Slide Storage Capacity | 100 slides |
| Power Supply Range | AC220V ±15%, Frequency: 50/60Hz |
| Power Consumption | ≤200VA |
| Operating Temperature | 5℃ ~ 40℃ |
| Humidity Range | ≤80% |
| Sample Loading Capacity | Single slide |
| Scanning Speed | ≤10.6cm²/min |
| Scanning Resolution | ≤0.35 μm/pixel |
| Detection Time | 5 min: scan start to report; excludes preparation and loading/unloading |
| Operating Software | Windows |
Reports and Method Evaluation
Reports show the measured distribution and image-linked results. Agree on applicable methods, calibration and acceptance criteria for each sample type.
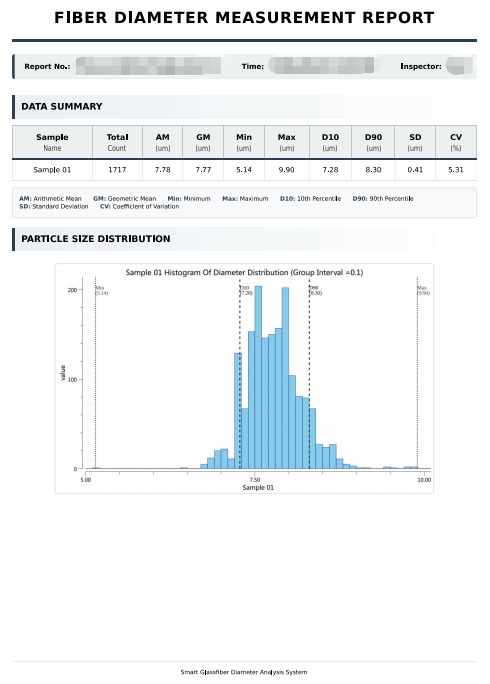
The report includes multi-dimensional key indicators to clearly present diameter distribution and stability:
- Basic Statistics:Mean diameter, standard deviation, coefficient of variation, and maximum/minimum values, reflecting batch consistency;
- Percentiles:D10/D50/D90 are the diameter values (μm) at the 10th, 50th and 90th percentiles of the cumulative diameter distribution.
- Visualization:Diameter distribution histogram, intuitively presenting the distribution pattern for quick assessment of process compatibility.
Easy Access, Efficient Verification
The report supports online viewing. The full content can be accessed directly on the corresponding product page on the official website — no download required, allowing quality verification anytime, anywhere, and improving decision-making efficiency.
Online Trial
Experience test scenarios of real samples. You can browse the whole slide image, check the system's diameter analysis of each fiber, and generate a report with one click.
* The trial version is similar to the actual product UI, with partial functions available.
Application Scenarios
Widely used in quality inspection for reinforcing fiber manufacturers such as glass fiber, carbon fiber, basalt fiber, and quartz fiber, as well as in materials science research at universities and research institutes.
FAQ
How many fibers can one test include?
The system supports tasks with 10,000 or more fibers under suitable preparation and scan settings. Fast mode uses a smaller capture area and may count fewer fibers. Check the actual count in each report.
Can we evaluate our own samples?
Contact us with your material, sample volume and reporting requirements. Review representative sample measurements and agree on the configuration and acceptance criteria.
How can alumina-fiber results be reviewed?
Video 40 shows navigation from an individual thumbnail to the original image and separate counted and excluded objects. Check measurement positions, valid count and the corresponding report version.
Interested in this product?
Feel free to contact us by email or phone, and we will immediately arrange one-on-one support from an engineer.
Contact Us