Smart Quartz Fiber Diameter Analyser
Automatically scan, analyze, and generate a report containing comprehensive results including diameter average and distribution. Complete the analysis of 10000 fibers in 3 minutes, with an error of less than 0.1 μm in fiber diameter. Support visualization during whole process.
- Automatic scanning, automatic focusing, and automatic measurement with no manual intervention throughout the process
- AI deep learning algorithm that never misses a single fiber
- One-click generation of test reports compliant with GB/ISO/ASTM standards
- Data can be exported to Excel/PDF, with support for cloud data management
- Simple operation; ordinary workers can take up the post after brief training
Core Features
High Precision Diameter Analysis
With high-resolution scanning and advanced target segmentation algorithms, the error of fiber diameter automatic analysis is less than 0.1 μm.
Comprehensive Report
Automatically scan, analyze, and generate analysis reports, providing average, SD, CV, distribution histogram of diameter and more.
Visualization and Traceability
10000 fibers can be analyzed in a single test, and the image and diameter markings of every fiber can be viewed.
Automatic and Fast
Complete a single test in 3 minutes. Automated processes without human attendance.
Technical Parameters
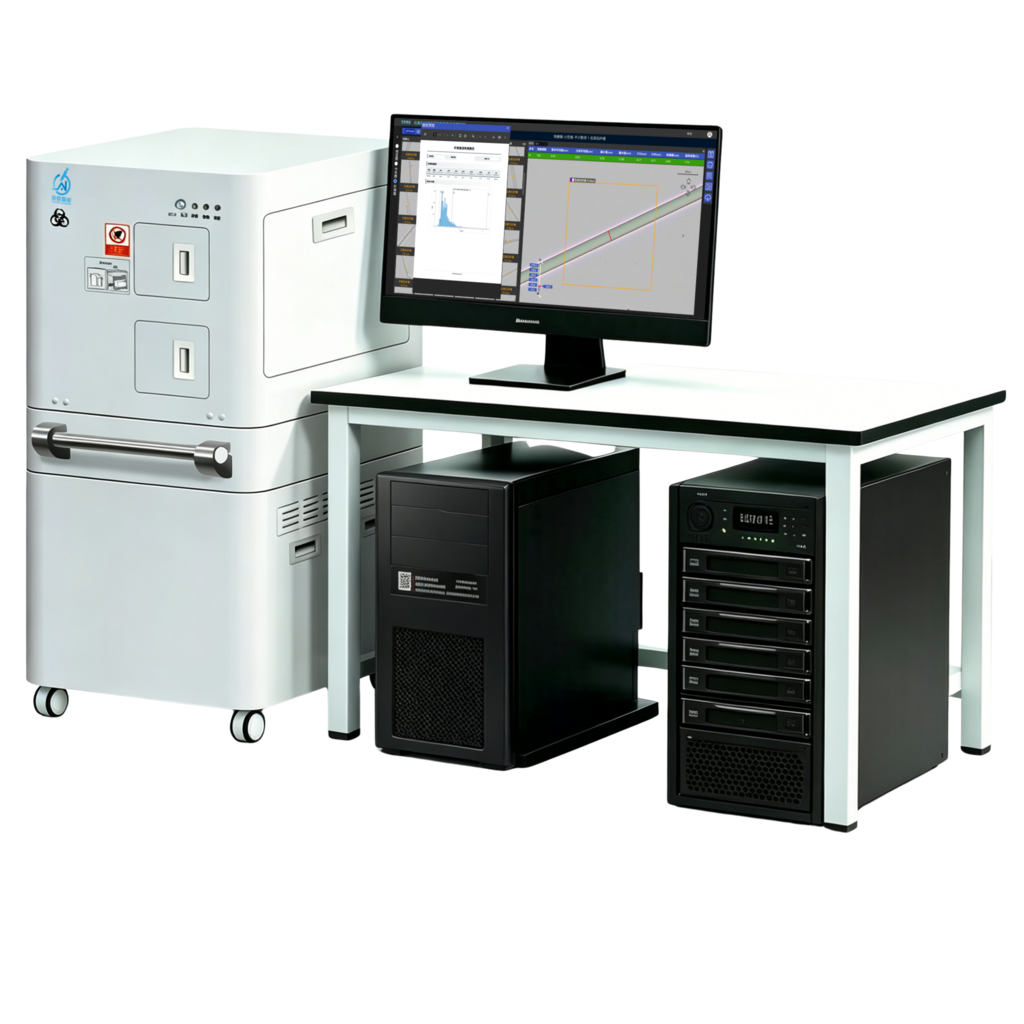
| Product Model | TW-H-20X-N-QZF-D-01 |
| Diameter Range | 4-25 μm |
| Number of Fibers per Single Measurement | Less than 10,000 fibers |
| Diameter Measurement Accuracy | 0.01 μm |
| Physical Magnification of Captured Images | 200x |
| Digital Magnification of Captured Images | 1000x |
| Historical Report Storage Capacity | 100,000 reports |
| Digital Slide Storage Capacity | 20,000 slides |
| Power Supply Range | AC220V ±15%, Frequency: 50/60Hz |
| Power Consumption | ≤300VA |
| Operating Temperature | 5℃ ~ 40℃ |
| Humidity Range | ≤80% |
| Maximum Throughput | Supports continuous loading and unloading; no less than 30 samples per single load. Maximum loading capacity not exceeding 240 samples. |
| Scanning Speed | ≤10.6cm²/min |
| Scanning Resolution | ≤0.35 μm/pixel |
| Detection Time | 3min |
| Equipment Operation Stability | 7*24 hours unattended operation |
| Operating Software | Linux, Windows |
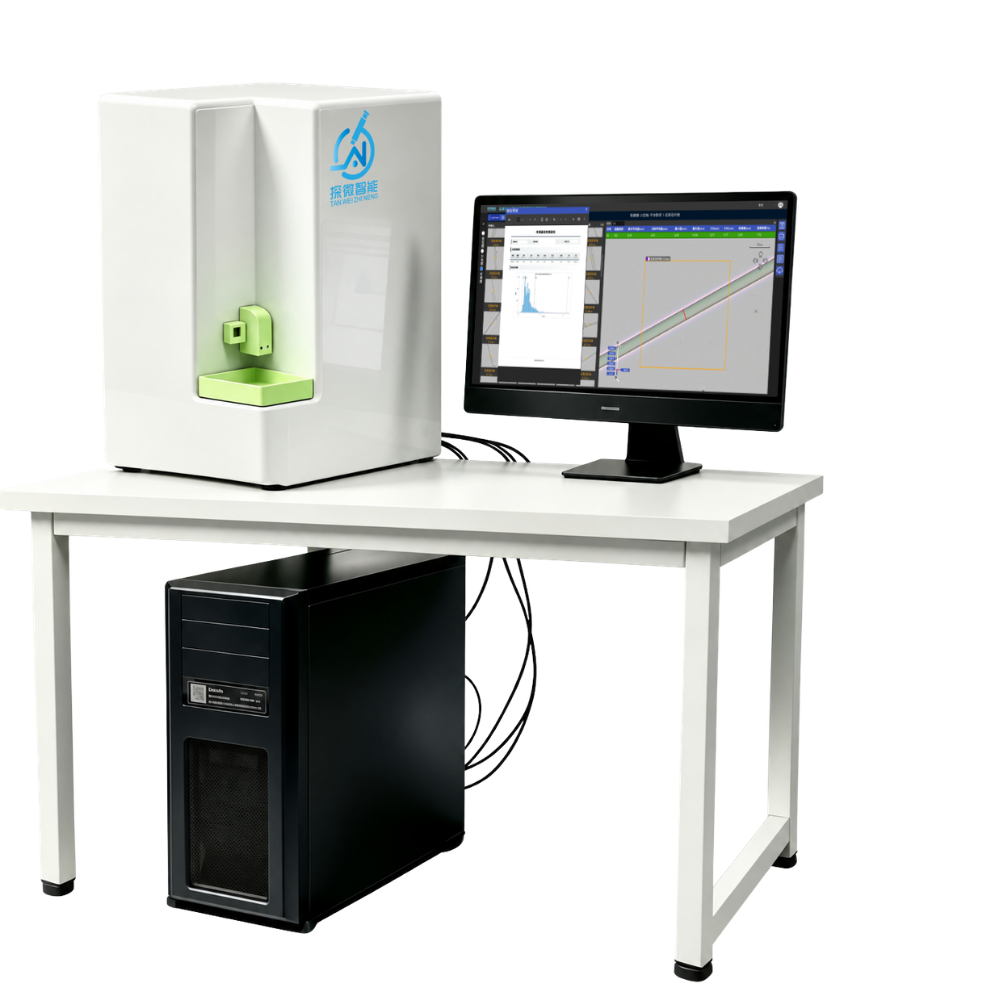
| Product Model | TW-D-20X-N-QZF-D-01 |
| Diameter Range | 4-25 μm |
| Number of Fibers per Single Measurement | Less than 10,000 fibers |
| Diameter Measurement Accuracy | 0.01 μm |
| Physical Magnification of Captured Images | 200x |
| Digital Magnification of Captured Images | 1000x |
| Historical Report Storage Capacity | 2,000 reports |
| Digital Slide Storage Capacity | 100 slides |
| Power Supply Range | AC220V ±15%, Frequency: 50/60Hz |
| Power Consumption | ≤200VA |
| Operating Temperature | 5℃ ~ 40℃ |
| Humidity Range | ≤80% |
| Maximum Throughput | Single slide |
| Scanning Speed | ≤10.6cm²/min |
| Scanning Resolution | ≤0.35 μm/pixel |
| Detection Time | 5min |
| Operating Software | Windows |
Internationally Compliant Professional Report
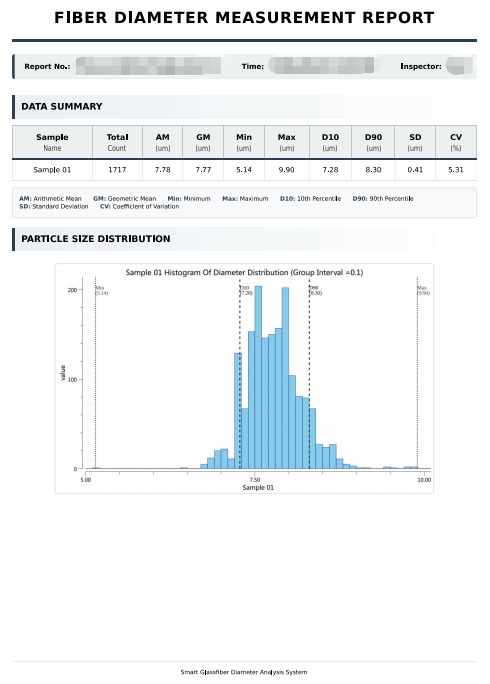
This report strictly adheres to 《 ISO 1888 2022 Textile glass - Staple fibres or filaments - Determination of average diameter》. It focuses on product diameter, provides accurate quantitative analysis, and serves as an authoritative basis for quality verification, material selection, and compliance review.
The report includes multi-dimensional key indicators to clearly present diameter distribution and stability:
- Basic Statistics:Mean diameter, standard deviation, coefficient of variation, and maximum/minimum values, reflecting batch consistency;
- Characteristic Parameters:D10 (proportion of fine fibers) and D90 (proportion of coarse fibers), precisely matching application requirements;
- Visualization:Diameter distribution histogram, intuitively presenting the distribution pattern for quick assessment of process compatibility.
Easy Access, Efficient Verification
The report supports online viewing. The full content can be accessed directly on the corresponding product page on the official website — no download required, allowing quality verification anytime, anywhere, and improving decision-making efficiency.
Online Trial
Experience test scenarios of real samples. You can browse the whole slide image, check the system's diameter analysis of each fiber, and generate a report with one click.
* The trial version is similar to the actual product UI, with partial functions available.
Application Scenarios
Widely used in quality inspection for reinforcing fiber manufacturers such as glass fiber, carbon fiber, basalt fiber, and quartz fiber, as well as in materials science research at universities and research institutes.
FAQ
Interested in this product?
Feel free to contact us by email or phone, and we will immediately arrange one-on-one support from an engineer.
Contact Us