Dimensions & Geometry
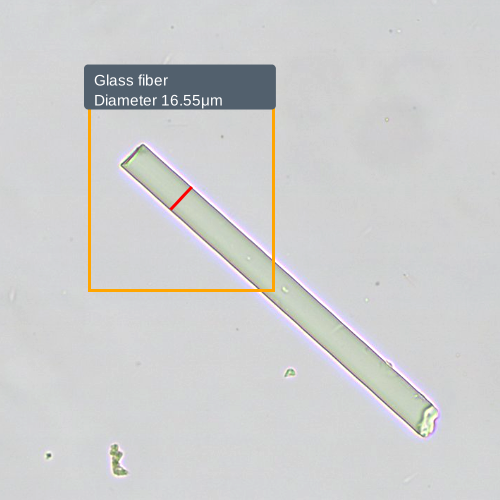
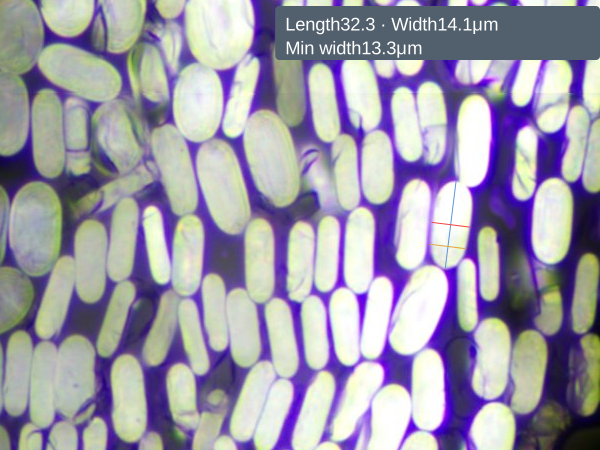
Length, diameter, width, minimum width, aspect ratio and equivalent diameter.
Custom Microscopic Inspection Solutions
Turn Your Microscopic Observations into Reviewable Data
Combine scanning equipment, imaging and software around your samples and measurements, with a complete workflow from image capture to report delivery.
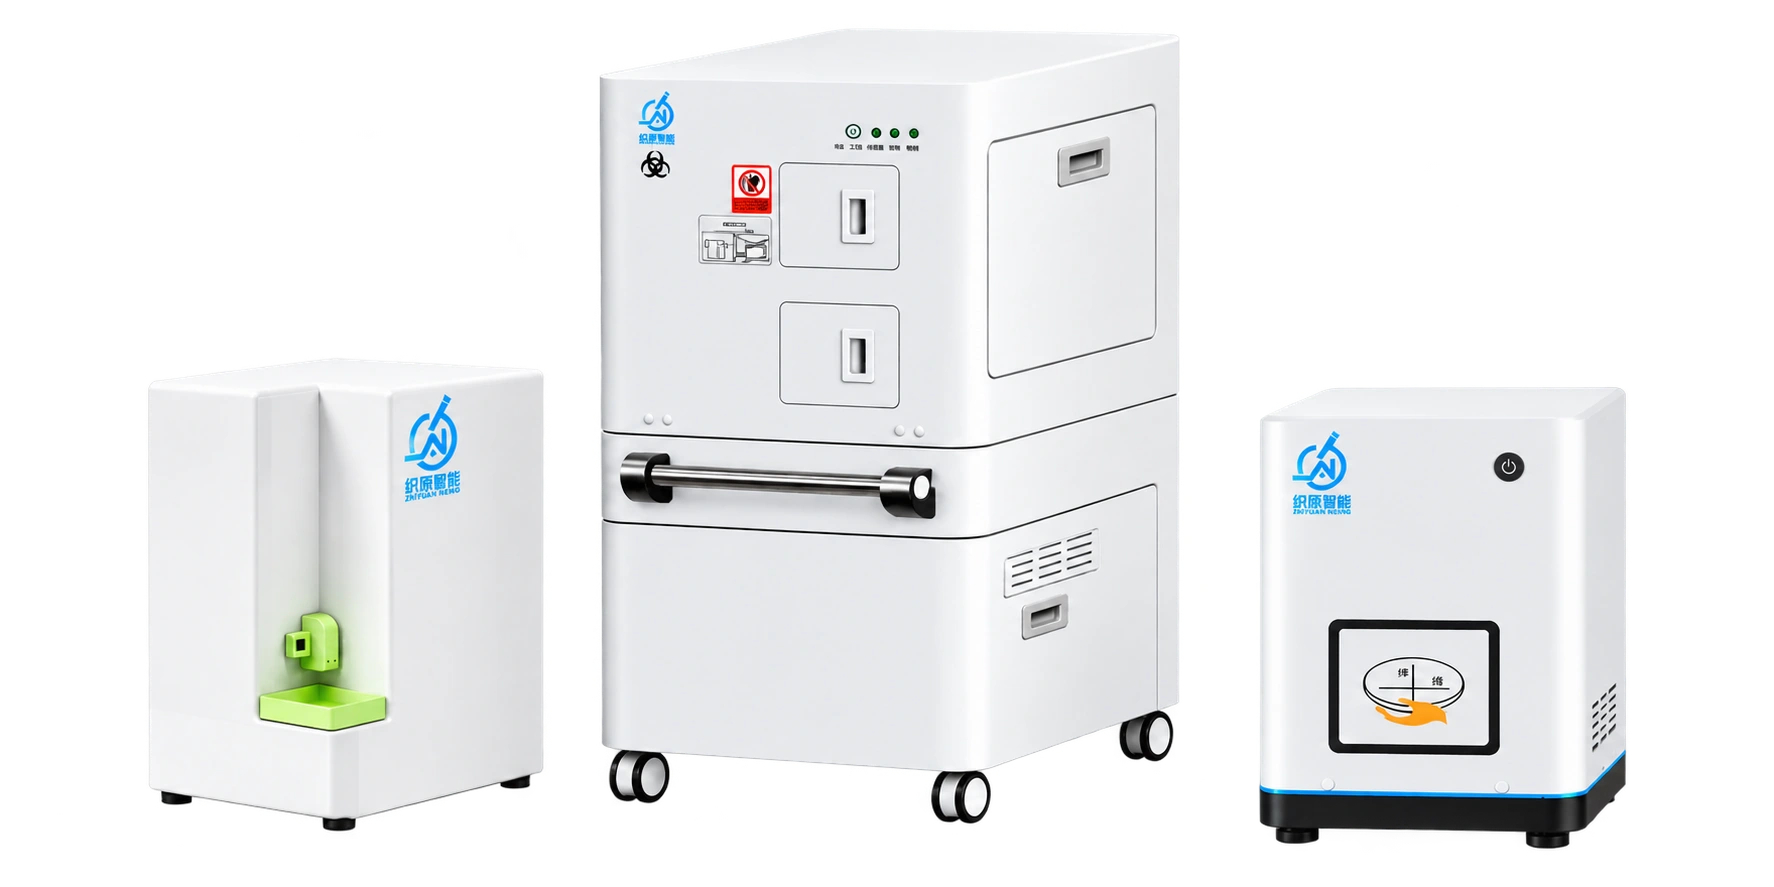
Measure dimensions, examine morphology, analyze distributions and identify abnormalities. Define your key measurements to focus the inspection on your needs.
Length, diameter, width, minimum width, aspect ratio and equivalent diameter.
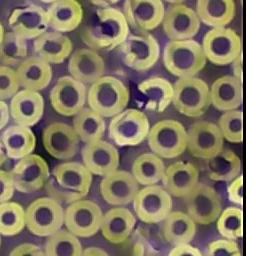
Inner and outer contours, inner and outer dimensions, wall thickness, pore size, hollow-section proportion, hollowness.
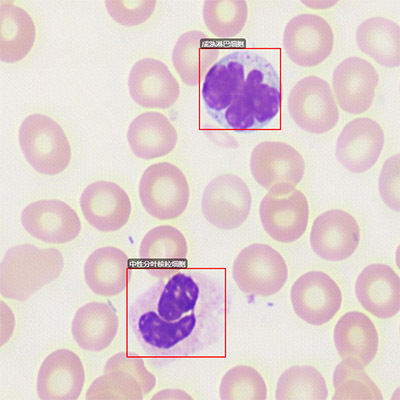
Cell and nuclear size, shape, nucleus-to-cytoplasm ratio, counts, classes and morphological differences.
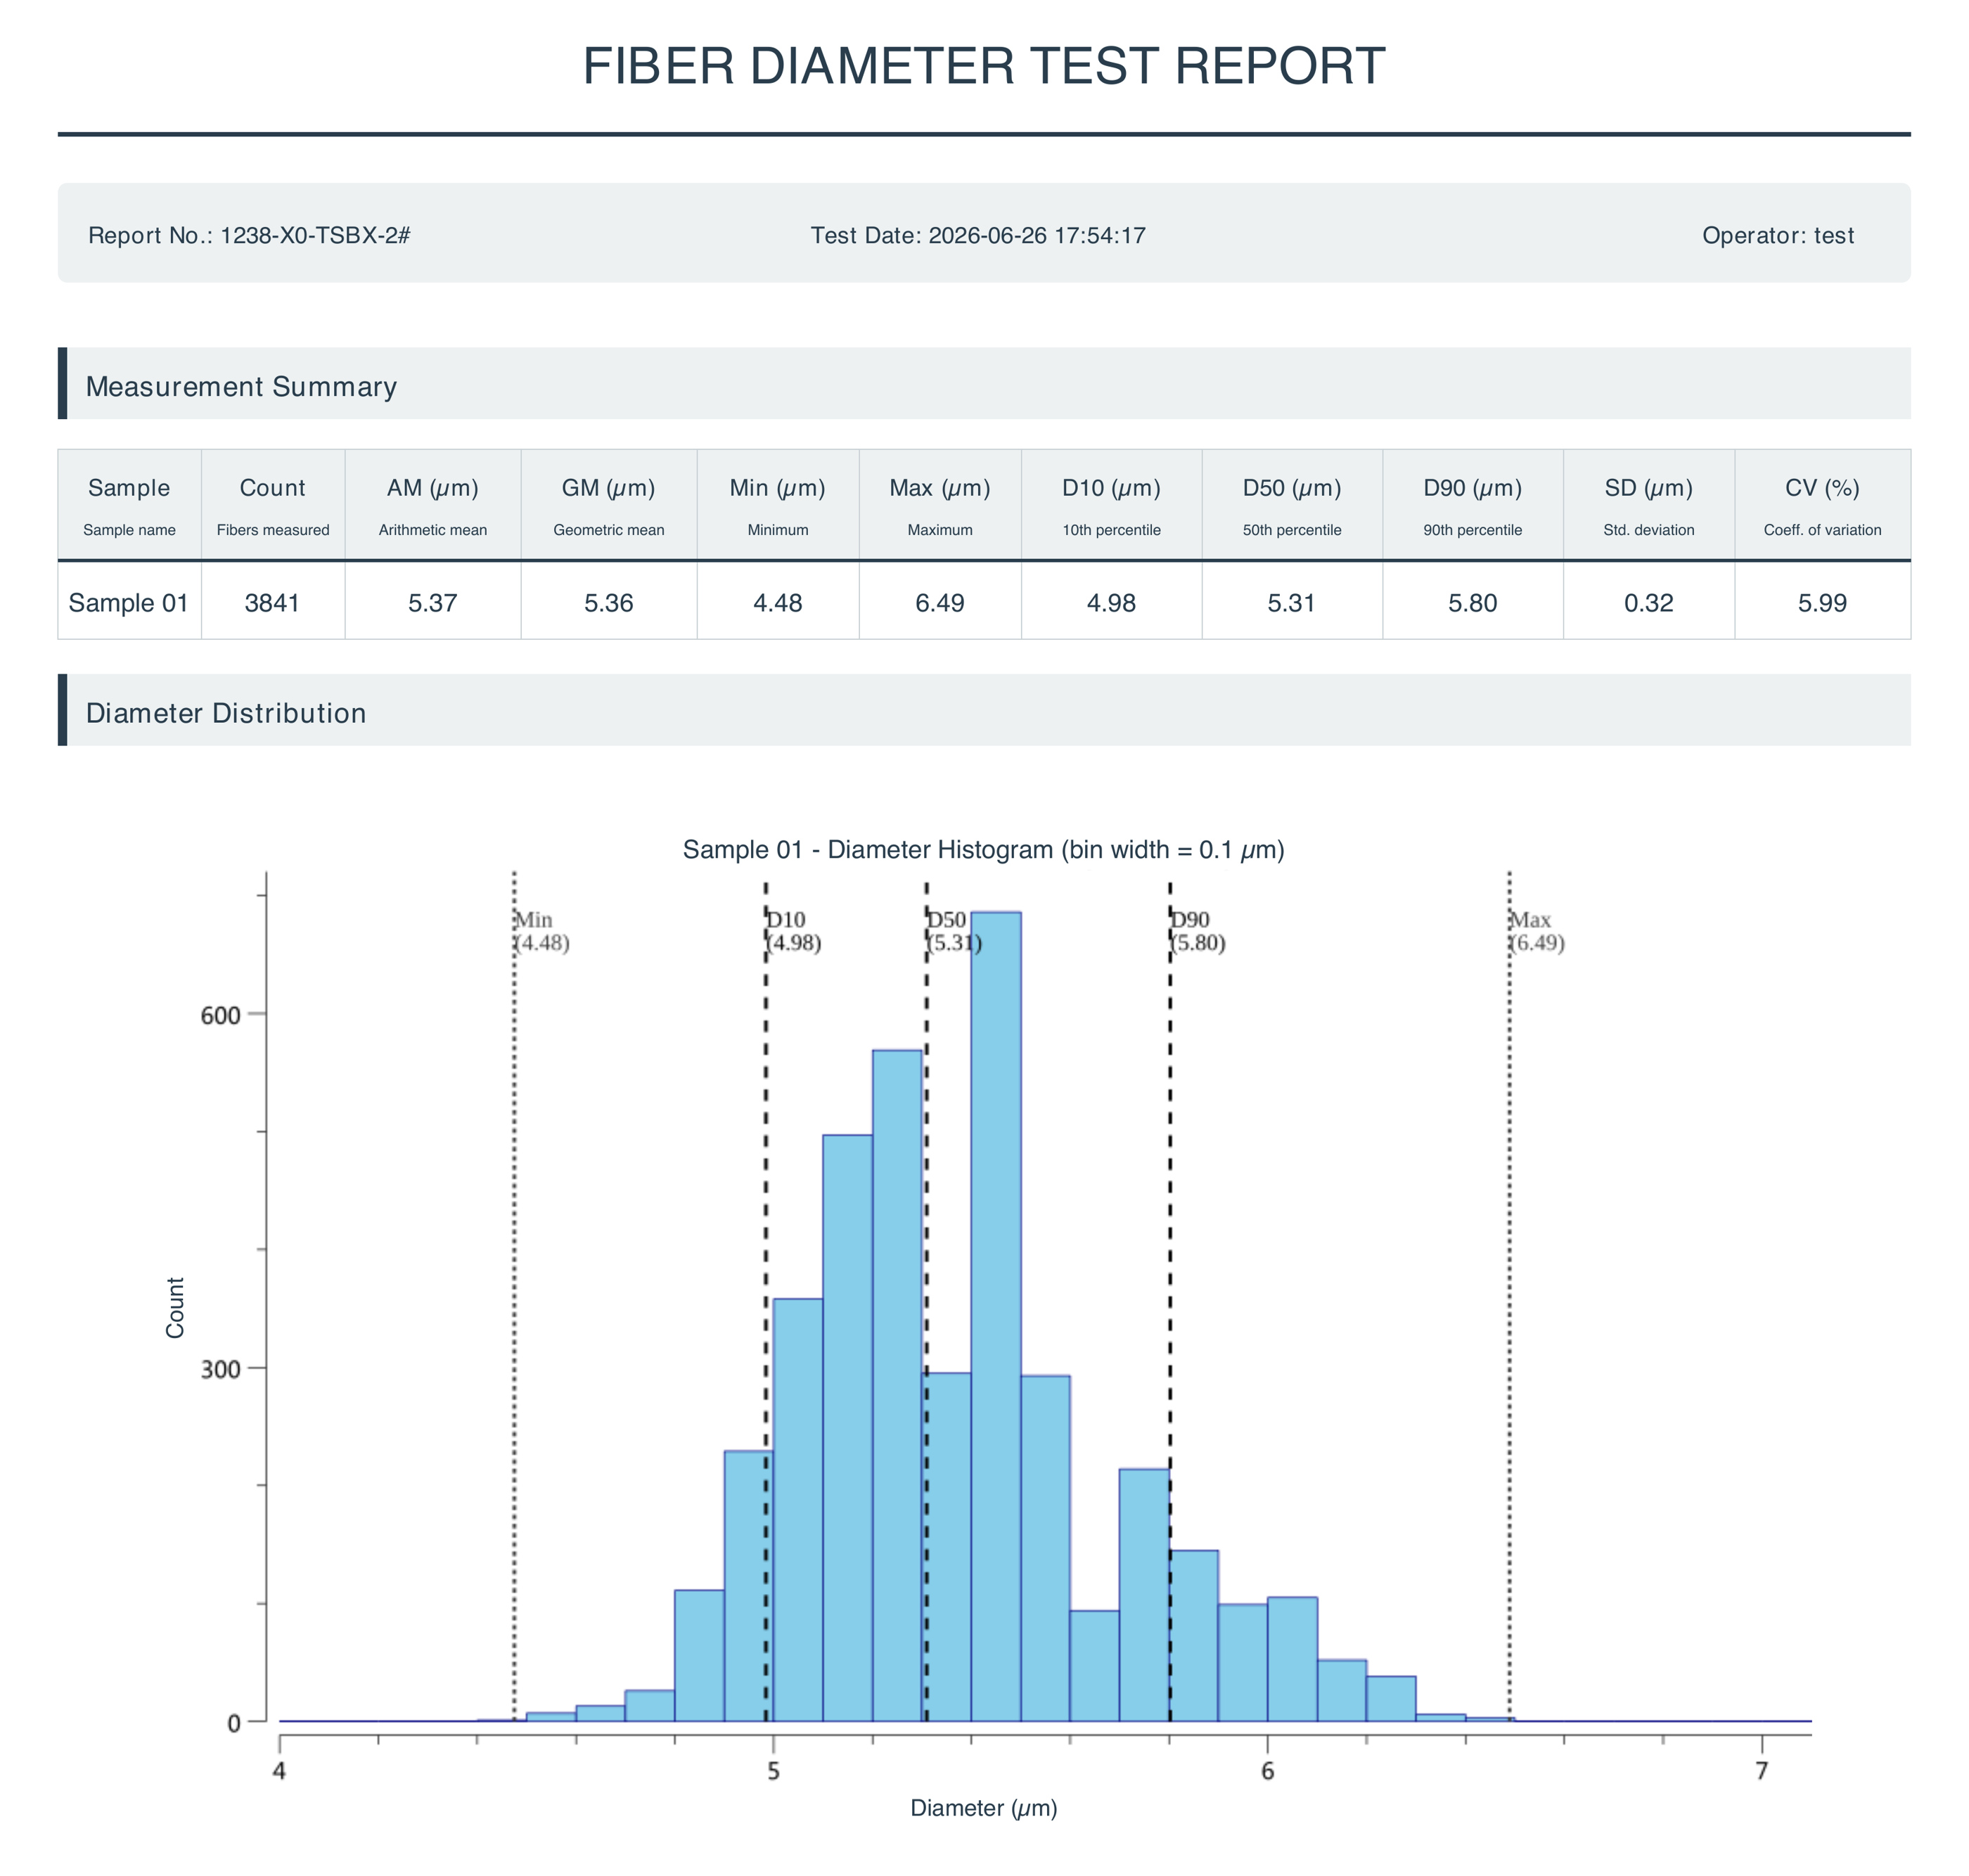
Object counts, density, composition, size distributions, mean, standard deviation and coefficient of variation.
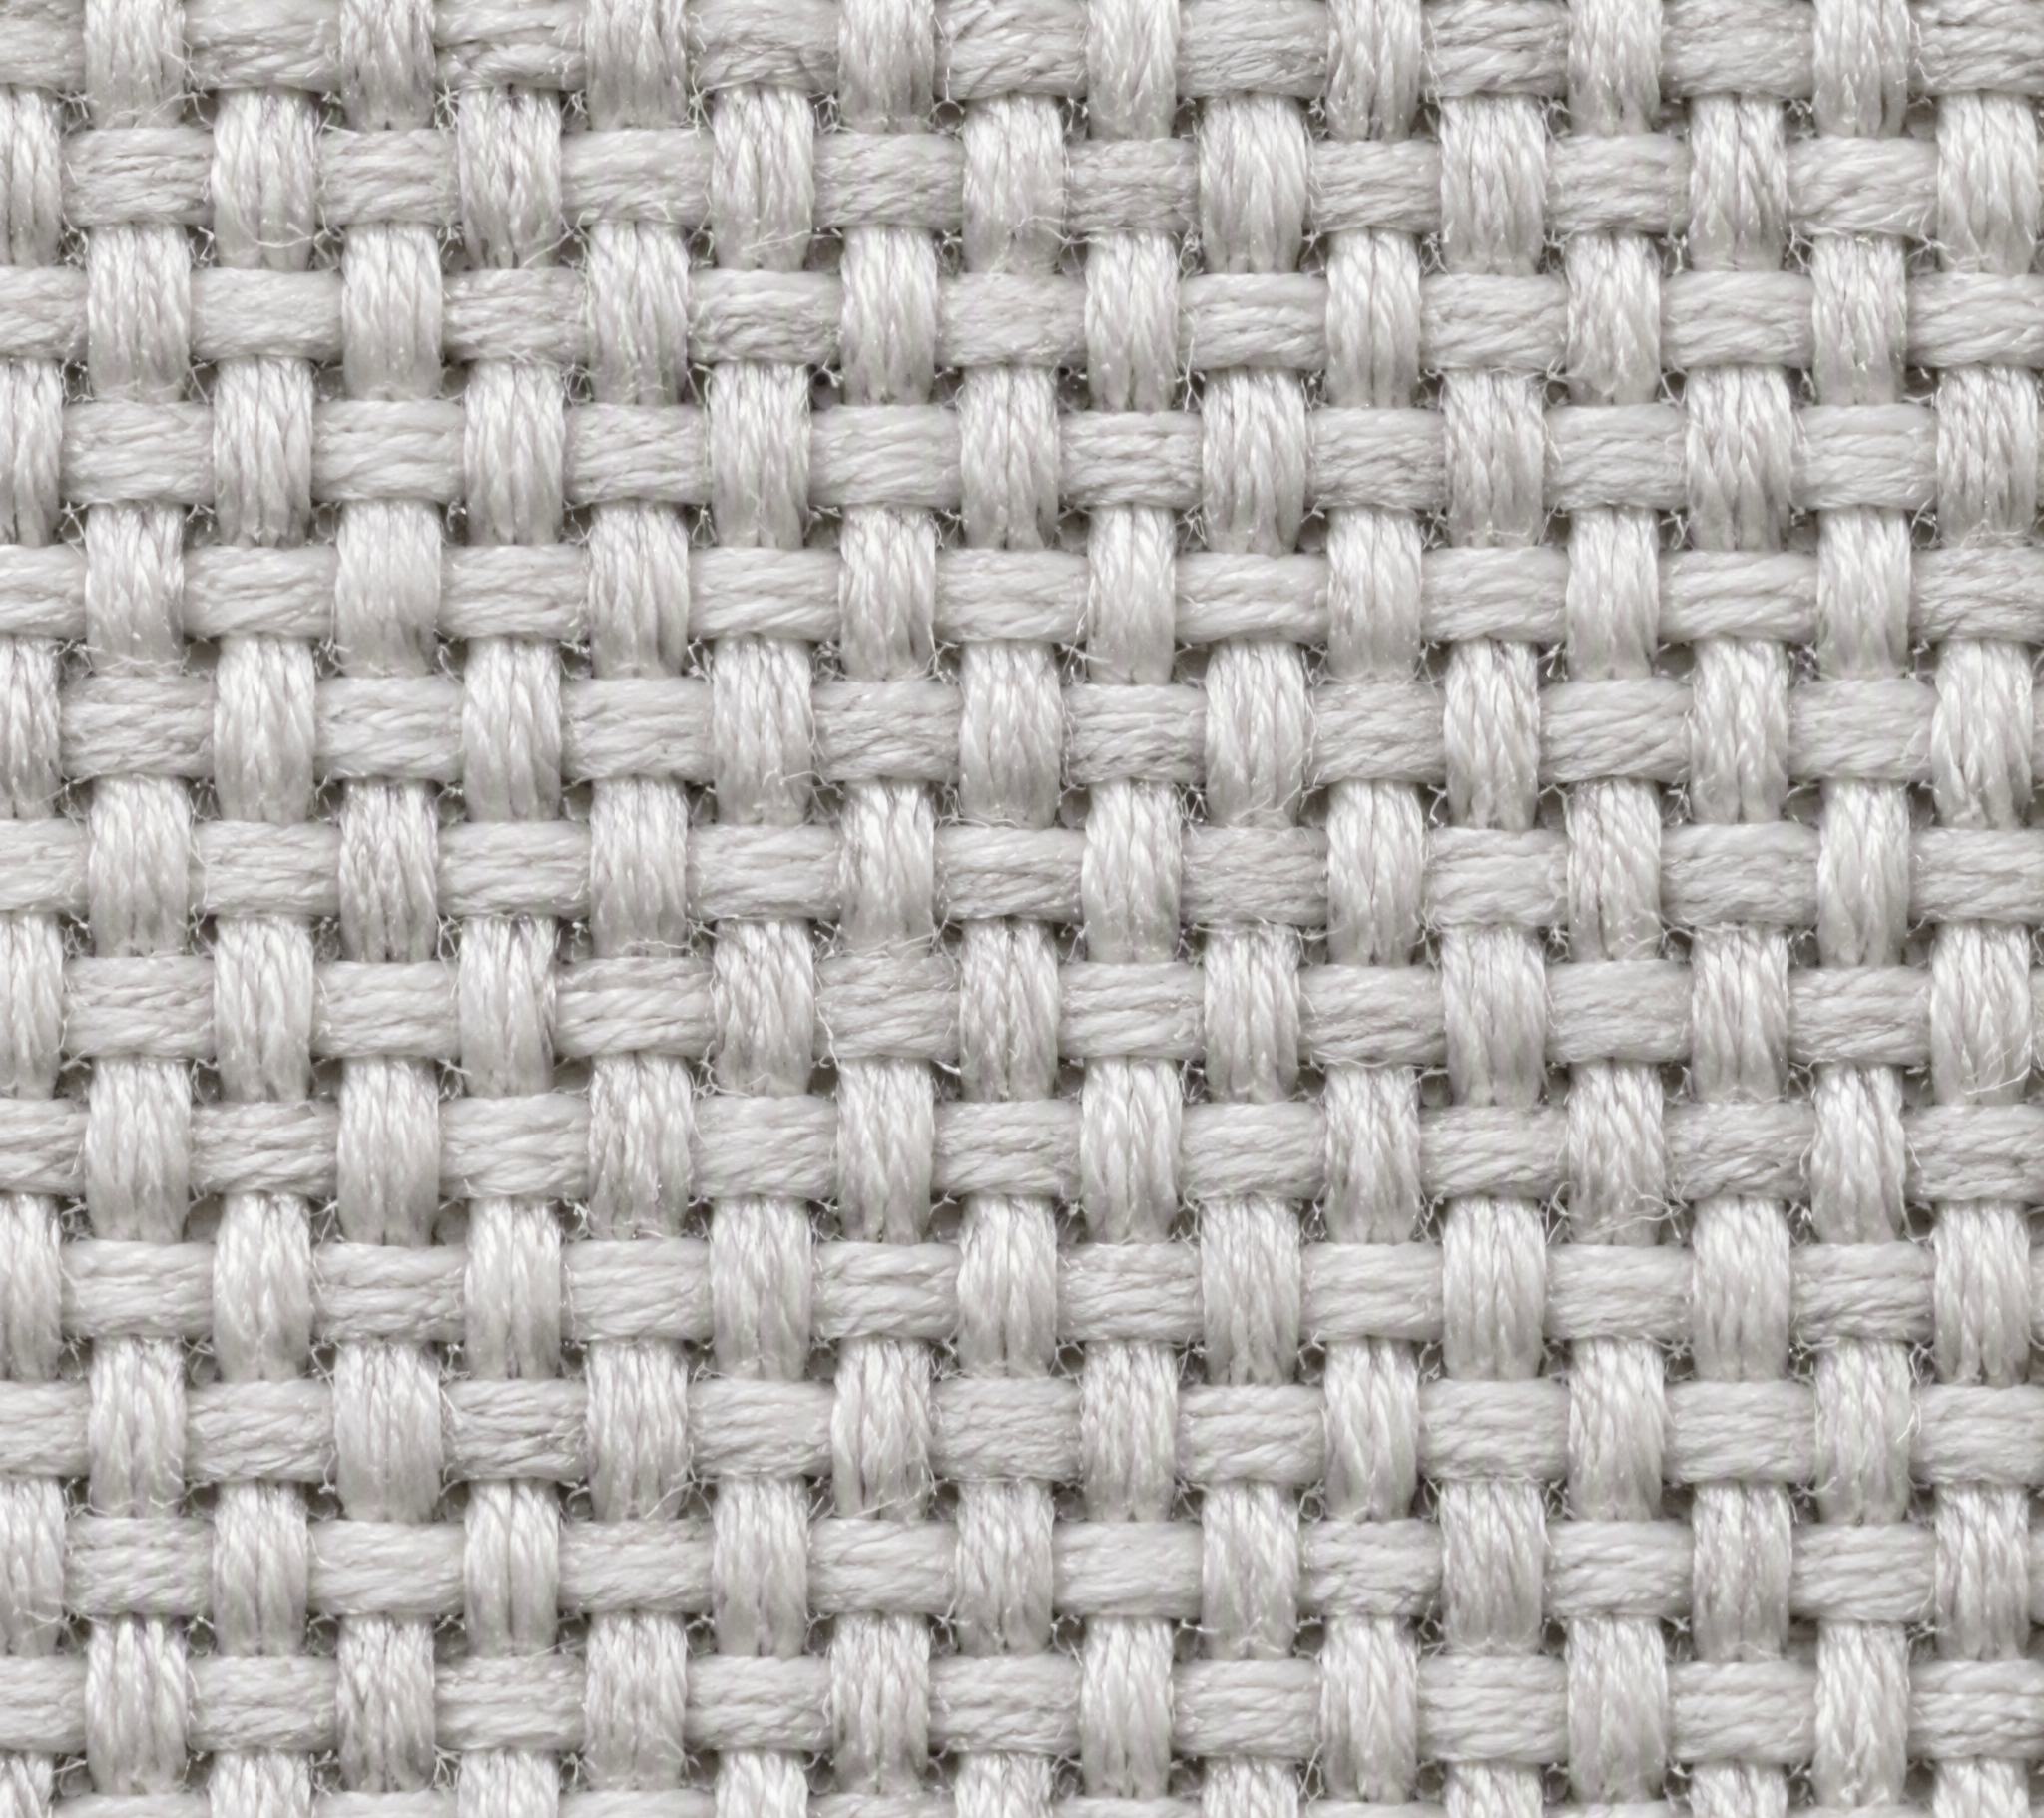
Warp and weft density, yarn width, texture orientation and weave structure.
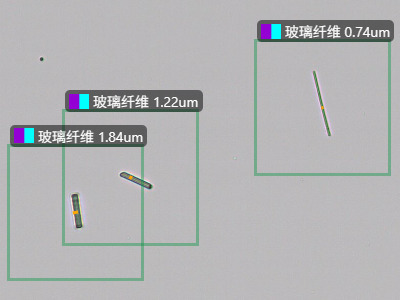
Impurities, contamination, foreign objects, breaks, cracks, agglomeration, edge defects, color and grayscale variations.
These are potential inspection and development areas. Specific measurements require evaluation of preparation, imaging and annotated samples. Cell morphology results assist professional observation and review.
Different materials and shapes require different approaches. Evaluate the solution with real images of your samples.
Glass, ultrafine, alumina, carbon, basalt and quartz fibers, including hollow fibers, special-shaped cross-sections and fiber powder.
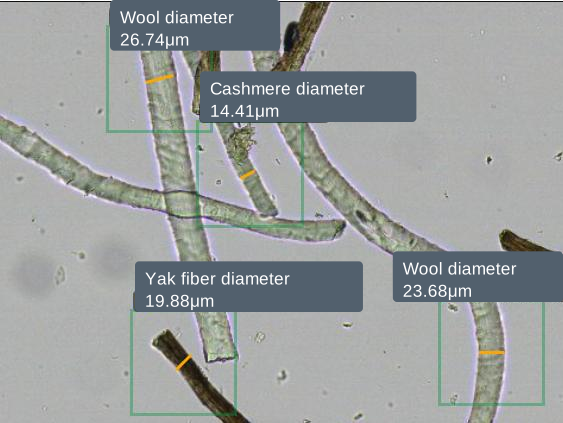
Sheep wool, cashmere, mohair, alpaca, rabbit hair, yak down and silk; analyze diameter, length, morphology and composition.
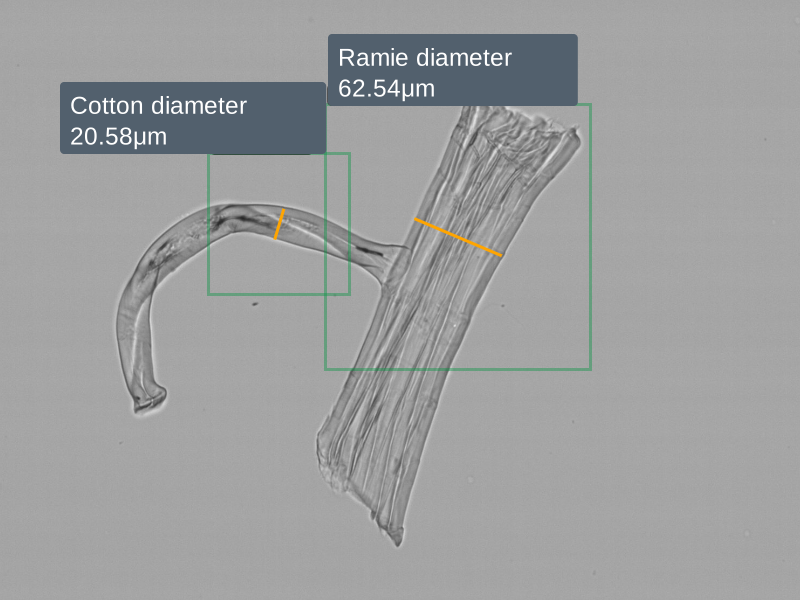
Cotton, flax, ramie, jute, hemp, wood pulp and other plant-derived fibers.
Cells in peripheral blood, bone marrow and cerebrospinal fluid; examine cell outlines, nuclei, cytoplasm and staining morphology.
Plain, twill, satin, check and striped weaves, electronic fabrics, and yarns, knitted fabrics or nonwovens requiring evaluation.
Images illustrate the sample categories. New materials and fabric structures require evaluation of preparation, imaging and recognition conditions.
Connect custom high-resolution scanning, automatic measurements, reports, review and data delivery into your workflow.
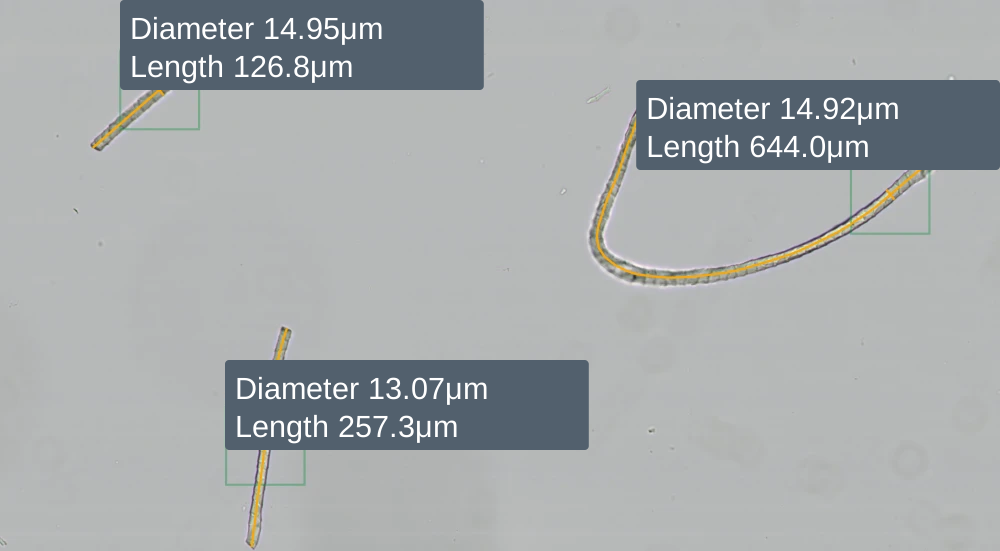
Images illustrate workflow stages using different samples. Scanning, measurements and reports are customized to your requirements.
Select imaging, illumination, magnification and scan area for your samples, with suitable equipment and autofocus.
Define objects, classes and abnormalities using actual samples, then develop and validate a dedicated recognition library.
Locate and segment objects, extract agreed measurements and compile individual results.
Organize results using agreed statistical rules, with custom report fields, charts, layouts and assessment criteria.
After automatic report generation, users review original images, detected objects and measurement markers.
Export PDF reports, Excel records and statistics for your existing data workflows.
Tell us your samples, measurements, daily workload and required report formats. Evaluate imaging and results through sample images, remote demonstrations or physical samples where practical, then confirm equipment, workflow and delivery scope.
These scenarios describe practical inspection needs. Images and statistics come from real samples; customer and project identifiers have been removed. Values apply only to the samples shown.
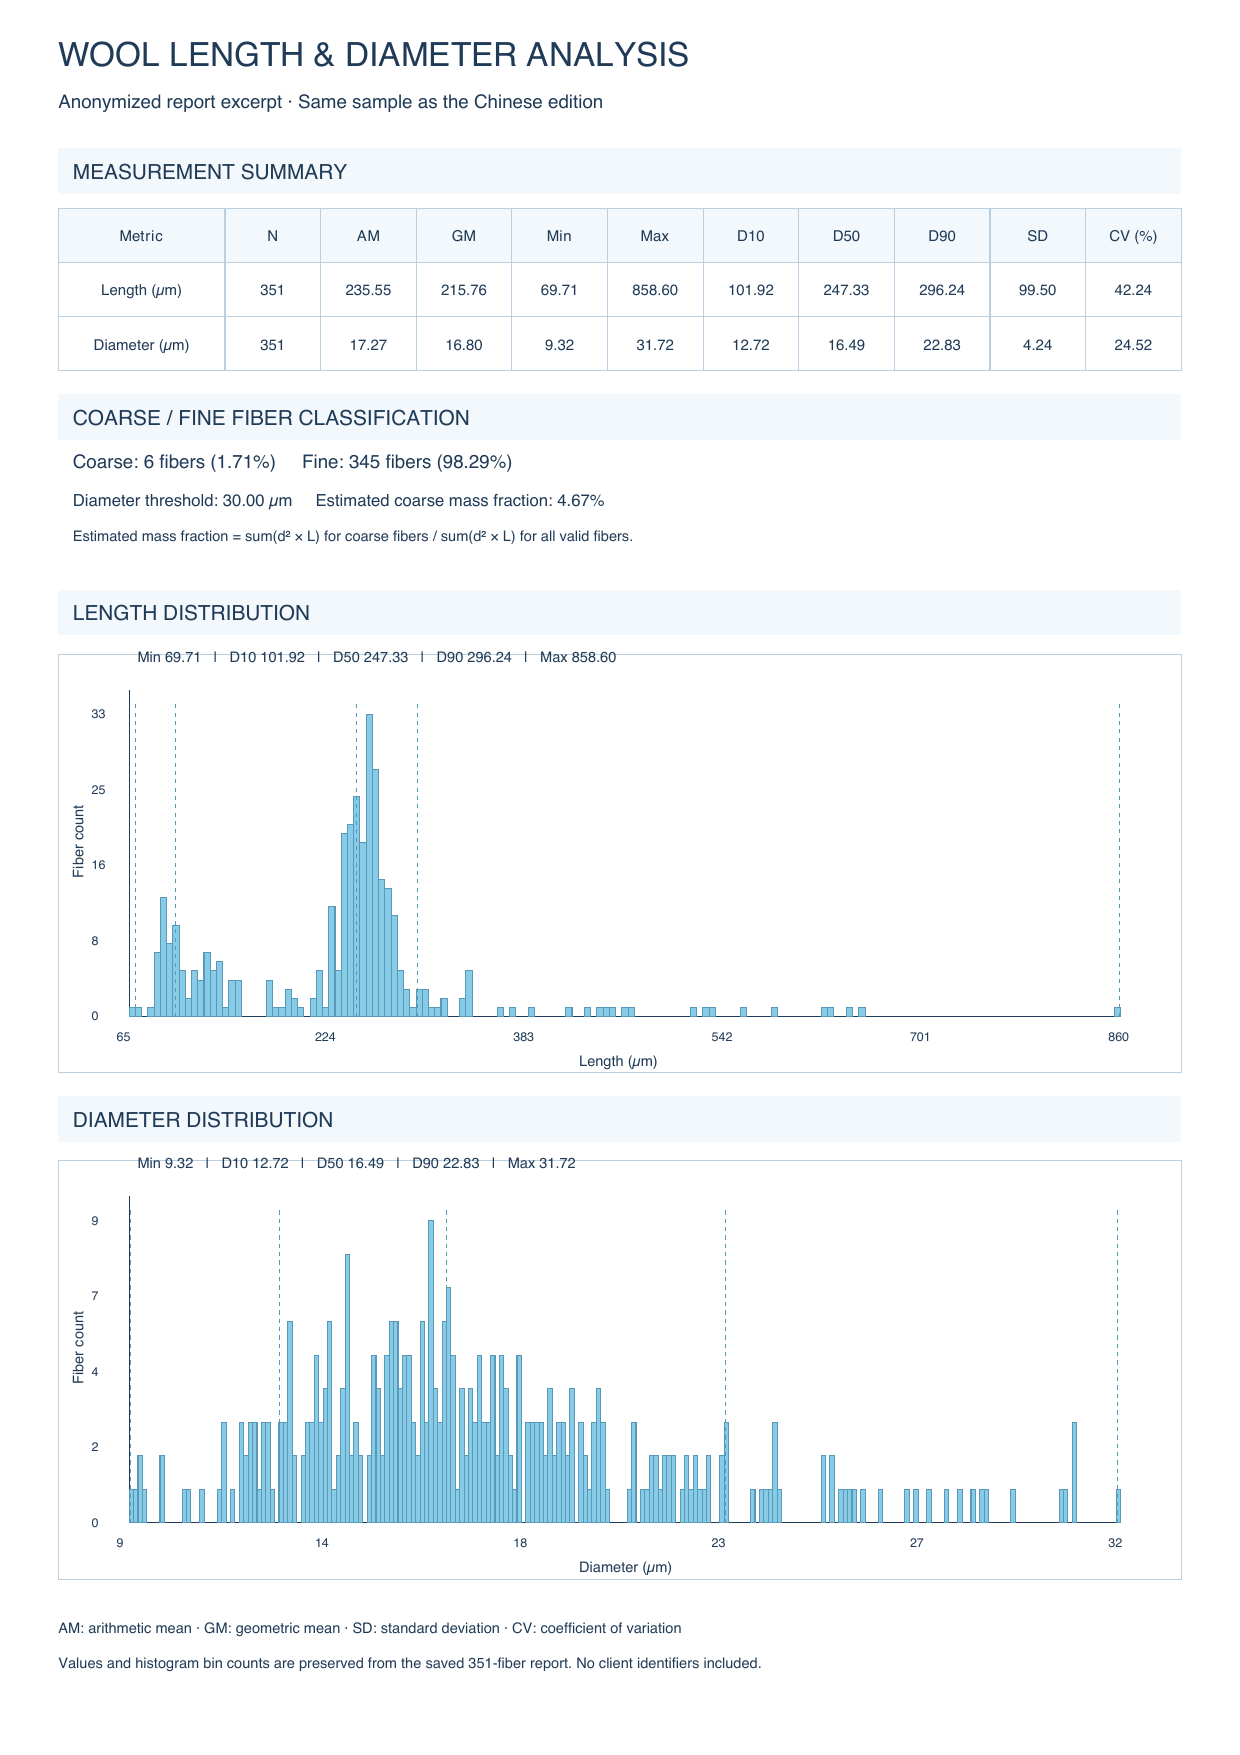
Measure length and diameter in the same wool sample, retain individual images and view both distributions. Classify coarse and fine fibers using agreed thresholds, rather than describe the whole sample with one average.
Define scanning from preparation and imaging results; recognize wool fibers and extract length and diameter. Compile means, percentiles, standard deviations and coefficients of variation. Automatically generate reports with distributions, individual measurements and coarse/fine counts, followed by manual review and data export.
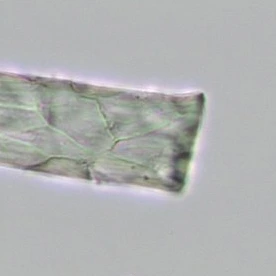
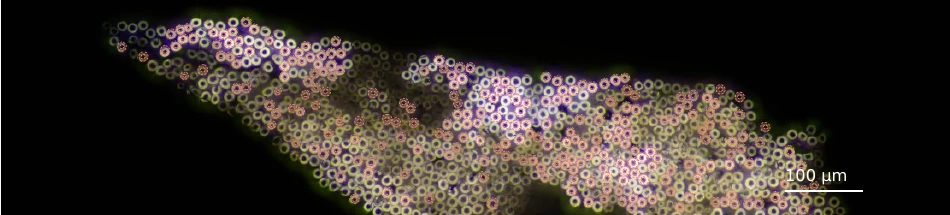
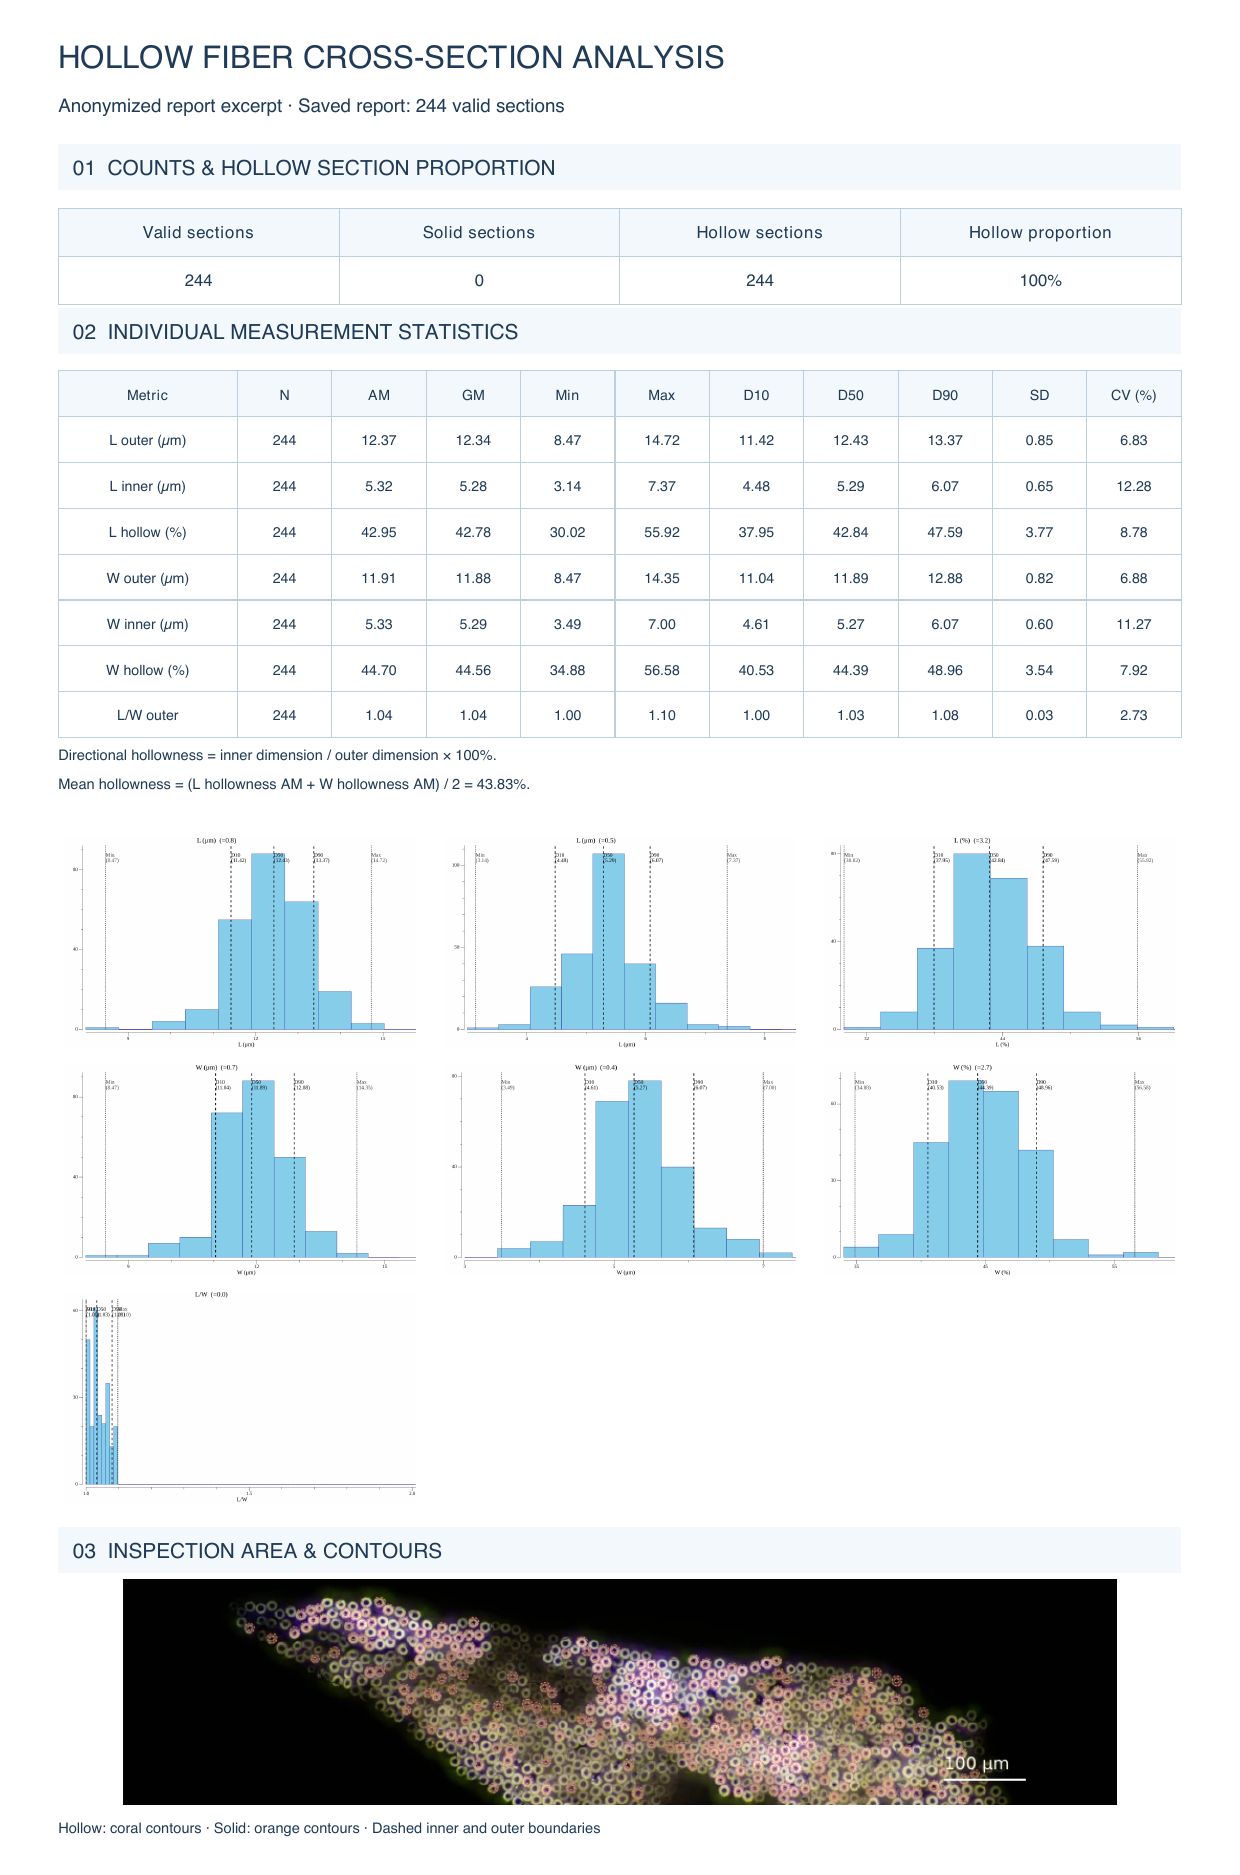
Inspect hollow quartz glass fiber cross-sections in batches. Distinguish hollow from solid sections, measure inner and outer dimensions in different directions, analyze hollowness and shape distributions, and link statistics to inspection images.
Customize scanning and contour recognition to extract inner and outer dimensions, hollowness and aspect ratio. Automatically exclude cracked, broken and excessively dark fibers from statistics, then generate the report. Distributions and a full inspection-area view support subsequent manual review of boundaries, measurements and abnormalities.
Hollow section proportion is based on accepted cross-sections. Mean hollowness averages the inner-to-outer dimension ratios in the length and width directions. These are different measurements.