After much anticipation, GB/T 47086-2026, Reinforcing Fibers and Microfiber Wool—Determination of Diameter and Its Distribution—Digital Optical Scanner Method, has finally been published. The new national standard will take effect on 2026-08-1. As the first national testing-method standard to apply artificial intelligence to the measurement of diameter distributions in reinforcing fibers and microfiber wool, GB/T 47086-2026has milestone significance. Its publication and implementation introduce a new approach to allocating resources: AI replaces traditional experience-based analysis, knowledge and experience are embedded in models, and technical capabilities become part of fixed assets. This frees inspectors from intensive visual and manual work, makes results more objective and stable, and resolves longstanding differences between operators.
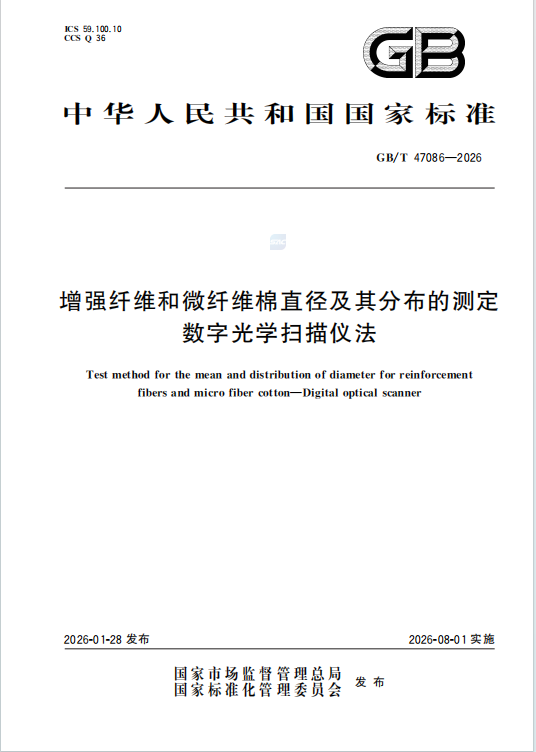
(The download link is provided at the end of this article.)
GB/T 47086-2026 applies to diameter inspection of reinforcing fibers and microfiber wool, including glass fibers, carbon fibers, basalt fibers, alumina fibers, silicon carbide fibers, mineral wool and microfiber wool.
The method specifies how to determine the diameter and its distribution in reinforcing fibers with circular or approximately circular cross-sections and microfiber wool with an average diameter ≥0.5 μm using a digital optical scanner. Measurement is based on dispersing individual filaments, acquiring microscopic images and establishing a pixel-width–fiber-diameter calibration curve using reference samples or a micrometer scale. It defines requirements throughout the workflow, including equipment and materials, specimen preparation, curve generation, sample testing and result processing. Results must include arithmetic and geometric means and other required indicators, rounded as prescribed. Test reports must contain key information on the sample, instrument, method and results. Compared with traditional methods, this approach offers higher measurement efficiency, larger sample sizes and better repeatability.
As a principal drafting organization for the national standard, Tanvint worked with leading companies and research institutions, including Nanjing Fiberglass Research & Design Institute Co., Ltd. and Jushi Group Co., Ltd., to complete research, drafting, review and finalization over several months. During development of the standard, Tanvint incorporated the key technical specifications, practical experience and digital inspection solutions of its independently developed Automated Fiber Diameter Inspection Equipment. It supplied extensive authentic technical data and practical evidence for equipment configuration, specimen preparation, operating procedures and result processing, helping ensure that the standard is scientific, practical and implementable.
The company’s automated fiber diameter inspection equipment combines high-resolution microscopic image acquisition, intelligent image recognition and big-data analysis to automate filament dispersion, intelligent edge recognition, precise pixel-width measurement and conversion to diameter values. It closely matches the core principles of the digital optical scanner method. The equipment supports dry measurement and simultaneously outputs arithmetic mean diameter, geometric mean diameter, D90/D10 distribution diameters, standard deviation and other data, while automatically generating diameter-distribution histograms. Its inspection efficiency and data precision substantially exceed traditional manual measurement, providing end-to-end quality inspection support for manufacturers of glass fibers, alumina fibers, microfiber wool and other reinforcing fibers.
Inspection Challenges for Manufacturers
Traditional testing is extremely inefficient and cannot meet end-to-end quality-control needs in mass production
Challenge 1: Traditional testing is extremely inefficient and cannot meet end-to-end quality-control needs in mass production
The traditional methods commonly used in the industry are manual optical microscopy and scanning electron microscopy (SEM). Both have critical efficiency limitations:
- Manual optical microscopy involves specimen preparation, manual field selection, individual fiber recognition and measurement, and manual recording and calculation. At least 50-100 fibers must be measured for a qualified sample. A skilled inspector needs 30-60 minutes per sample and can inspect only a little over 10 samples per day;
- Scanning electron microscopy provides higher precision, but specimen preparation is complex, requiring sectioning, gold coating and other pretreatments, and equipment environmental requirements are strict. A single inspection takes several hours, limiting it to final laboratory sampling rather than real-time monitoring during production.
Glass fiber and microfiber wool manufacturers typically operate continuous, large-scale production for 24 hours a day, with dozens of batches produced daily on a single line. Traditional methods permit only a very low sampling rate and cannot cover every batch and the entire process. Batch-quality fluctuations can easily go undetected, resulting in customer returns and substantial material scrapping. The conflict between quality-control needs and inspection efficiency is becoming increasingly pronounced.
Challenge 2: Uncontrolled human error, poor data consistency and traceability, and frequent quality disputes
The main shortcomings of traditional manual inspection are uncontrolled human error and very limited sample coverage:
- Visual fatigue, preferences in field selection and differences in judging fiber edges directly affect manual results. For ultrafine fibers around 1 μm, differences between operators can exceed 0.5 μm, directly affecting product-grade decisions;
- Traditional methods measure only a few dozen fibers at a time. Such small samples provide only an average diameter and cannot represent the distribution of an entire batch. Diameter-distribution uniformity is a key factor in microfiber-wool filtration accuracy and the mechanical stability of reinforcing-fiber composites; traditional methods cannot characterize quality across all these dimensions;
- Manual inspection data are often scattered records and calculations, without a complete chain linking original images to data. When upstream and downstream companies dispute quality, differing methods and operators often produce results neither party accepts. Trade-related quality disputes are frequent and costly to resolve.
Challenge 3: No unified digital inspection specification, no consistent market benchmark, and inferior products displacing superior ones
Before this national standard was published, China had standards for optical microscopy and SEM but no unified national specification for automated digital optical scanning. The industry therefore lacked consistency in methods, parameters and standards:
- Leading companies and research institutions had begun adopting digital image inspection, but equipment settings, specimen preparation, calibration rules and processing logic differed between suppliers, making results incomparable;
- Upstream manufacturers and downstream customers in wind power, new energy and aerospace used differing testing methods and did not mutually recognize results. Without a unified national digital inspection standard, Chinese exporters also frequently encountered technical barriers from overseas customers;
- Many small and medium-sized enterprises lacked advanced inspection capabilities and relied on outdated methods with inadequate quality control. Product quality varied widely, and no unified standard established a quality threshold. Inferior products consequently displaced superior ones, restricting improvement in overall industry quality.
Challenge 4: High-end transformation places stringent demands on inspection that traditional methods cannot meet
As China’s advanced-materials industry develops, reinforcing fibers and microfiber wool are moving beyond traditional construction materials into chip packaging, aerospace, new-energy lithium batteries, high-end medical filtration and hydrogen fuel cells, placing stringent demands on diameter inspection:
- Ultrafine fibers used in high-end applications commonly fall within 0.5-3 μm. Diameter deviation must be controlled within ±0.1 μm, with strict distribution-uniformity requirements that traditional manual precision and sample sizes cannot meet;
- The shift toward smart manufacturing and lights-out factories requires inspection data to be uploaded to production systems in real time for closed-loop process control. Delayed manual testing and nonstandard data formats cannot integrate with industrial smart-manufacturing systems and have become a bottleneck in digital transformation.
Challenge 5: High labor costs and occupational-health risks, with no established basis for automated replacement
Traditional manual inspection imposes substantial overall cost pressures:
- Skilled fiber inspectors require months of specialist training. Training is expensive and staff turnover is high. Prolonged, intensive microscopic measurement can damage eyesight and create occupational-health risks, making recruitment increasingly difficult;
- Advanced equipment such as SEM can cost several million yuan, with high maintenance and consumable costs and a need for specialist operators. Such costs are beyond many small and medium-sized enterprises, resulting in a pronounced divide in inspection capabilities;
- Although automated fiber inspection equipment is available, the absence of a unified national standard leaves companies without a selection basis or compliance support. They cannot incorporate automated results into statutory quality-control systems, seriously limiting adoption.
Current Fiber Inspection Methods
Under the current inspection procedure (based on GB/T 7690.5-2013), purely manual operation measures only 25 fiber diameters, or at most 100, and calculates an average. It cannot measure the diameter distribution of an entire fiber bundle.

Solution Workflow
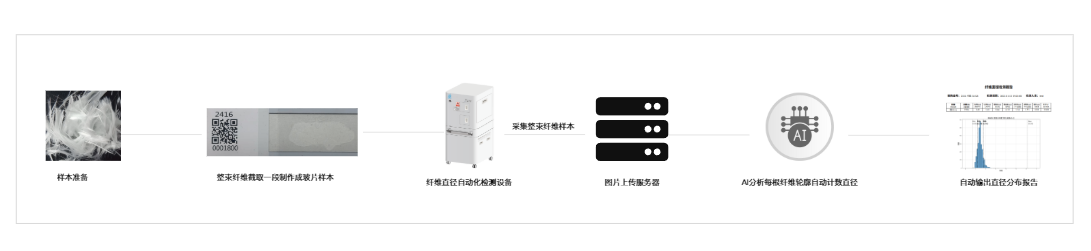
Prepare the sample on a glass slide and scan the entire slide using automated fiber diameter inspection equipment without omitting any fiber. AI distinguishes target fibers from non-target fibers, locates target-fiber contours and measures their diameters, then automatically outputs a diameter-distribution report.
 Technological Innovation
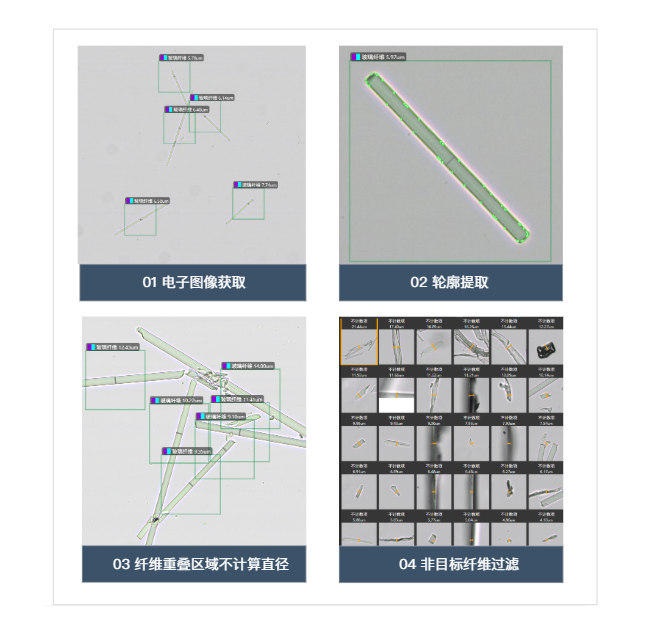
The diameter of every filament in an entire bundle can be measured automatically. Non-target fibers are filtered from the scanned digital images and excluded from diameter calculations and statistics. Diameters are not calculated in crossing or overlapping regions. Each filament is measured pixel by pixel and averaged; bending and folding do not affect the calculated results.
Automated Fiber Diameter Inspection Equipment
Save 90% of labor and improve efficiency 10-fold
Tanvint’s Automated Fiber Diameter Inspection Equipment draws on AI-based reinforcing-fiber inspection research and industrial applications. Intelligent image recognition is supported by terminal equipment comprising image acquisition, image recognition, AI algorithms and mechanical control modules, together with a backend management platform. It replaces processes that previously relied on visual inspection with intelligent equipment, collecting and analyzing data while automating inspection. This enables further digital transformation of inspection organizations and factories and improves product quality.
Product Introduction
Applicable to automated diameter inspection of continuous and short reinforcing fibers, with automated reporting. Outputs include total measured fiber count, D10, D90, standard deviation, maximum, minimum, coefficient of variation, geometric mean, arithmetic mean and a diameter-distribution histogram at intervals of 0.1 μm.
Product Features
Clear imaging
Technical Specifications
| Maximum Throughput | Supports cyclic loading and unloading, with at least 30 samples per loading cycle and a maximum loading capacity of at least 240 samples. |
| Physical Magnification of Acquired Images | 200× |
| Digital Magnification of Acquired Images | 1000× |
| Diameter Range | 4~25 μm |
| Number of Fibers Measured per Run | At least 10000 fibers |
| Software calculation precision 0.01 μm (not whole-system measurement error) | |
| Historical Report Storage | 1,000,000 reports |
| Digital Slide Storage | 30,000 slides |
| Supported Languages | Chinese, English |
| Scanning Speed | ≤1.74 cm²/min |
| Scanning Resolution | ≤0.35 μm/pixel |
| Inspection Time | 3min |
| Operating Stability | 7×24-hour unattended operation |
| Operating Software | Linux、Windows |
GB/T 47086-2026, Reinforcing Fibers and Microfiber Wool—Determination of Diameter and Its Distribution—Digital Optical Scanner Method
Standard text download link:
https://openstd.samr.gov.cn/bzgk/std/newGbInfo?hcno=527ECD131A9D8D7D2805604321640831